


Cost to Serve Analysis: The Hidden Lever Behind Profitability and Customer Success

.png)

Cost to Serve Analysis: The Hidden Lever Behind Profitability and Customer Success
Uncover how cost-to-serve analysis boosts profitability, efficiency, and customer success by identifying hidden costs across operations.

Imagine this - two customers order the same product, but one costs your business twice as much to serve. Same sale, vastly different margins. Most companies don’t see this gap until it’s too late. Cost to serve (CTS) analysis shines a light on the hidden operational costs that silently erode profitability - and helps you shift from gut feel to data-backed decisions.
What this blog covers:
- What is cost to serve?
- Why consider a cost-to-serve model for your business
- How to calculate cost to serve
- Transforming cost-to-serve analysis
- How Spendflo helps with cost-to-serve optimization
- Frequently asked questions on cost to serve analysis
What is Cost To Serve?
Cost to serve is a method of calculating the total cost involved in delivering a product or service to a specific customer, channel, or market segment. It includes everything from warehousing, logistics, and support to account management. Unlike traditional cost models, CTS dives deeper to uncover how much each relationship truly costs - beyond just the price tag.
Why Consider A Cost-To-Serve Model For Your Business
Understanding your true cost to serve isn’t just a finance exercise - it’s a strategic move that touches everything from pricing to procurement to customer success. Here’s why companies are adopting CTS models to sharpen their decision-making:
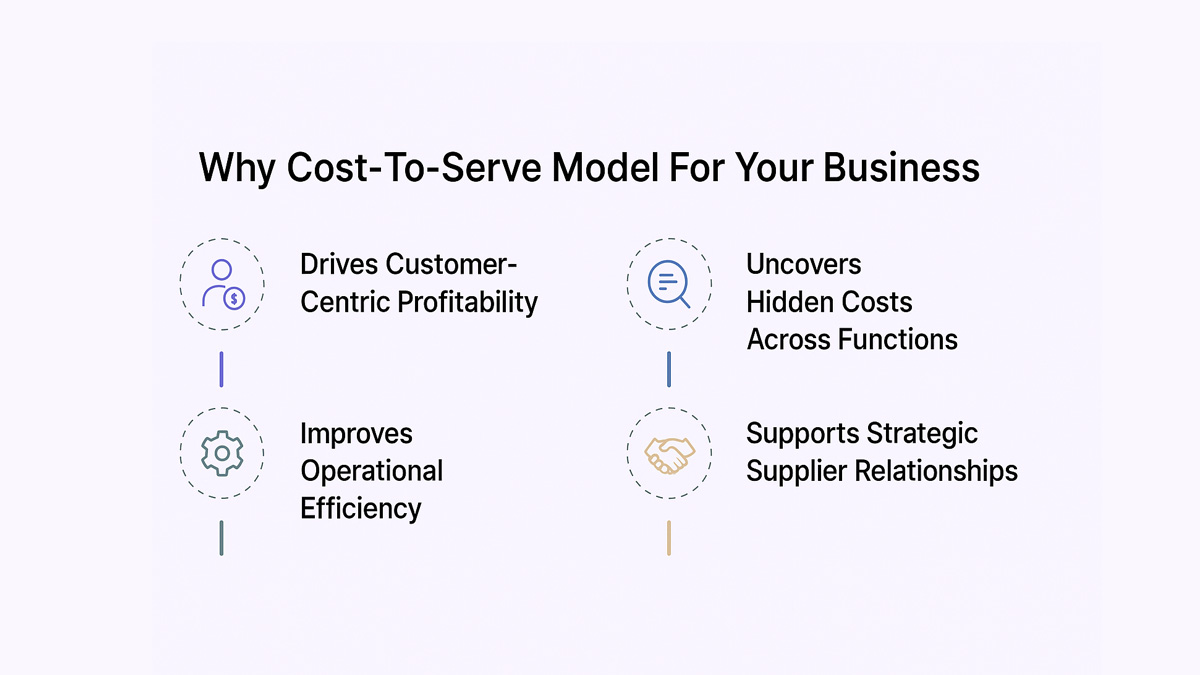
Drives Customer-Centric Profitability
Not all customers are created equal. Some bring steady, high-margin business with minimal handholding. Others demand frequent customizations, support, or last-minute shipments - all of which silently chip away at your margins. CTS allows you to segment your customers not just by revenue, but by profitability. That’s game-changing for customer strategy. This ensures that gross margin is considered alongside service complexity.
Improves Operational Efficiency
By breaking down costs across functions - sales, warehousing, delivery, returns - a CTS model highlights inefficiencies that would otherwise go unnoticed. One common example is excessive logistics costs linked to certain delivery routes. You’ll start to see which processes are bloated, duplicated, or unnecessary. That insight makes it easier to cut the fat without compromising service quality. It also ensures better resource allocation across departments.
Uncovers Hidden Costs Across Functions
Siloed departments often overlook the cumulative impact of their decisions. For example, a sales team might push for faster delivery to close a deal, but that urgency leads to premium shipping fees or overtime warehouse costs. These pressures often impact transport mode selection and its associated costs. CTS surfaces these interdependencies so leaders can weigh trade-offs holistically.
Supports Strategic Supplier Relationships
Suppliers that seem cost-effective on paper might be driving up indirect costs - late shipments, quality issues, or poor integration. CTS can highlight areas for sourcing optimization to reduce these burdens. It gives you a full-cost view of every supplier relationship, so you can negotiate better, consolidate vendors, or reevaluate partnerships altogether.
How To Calculate Cost To Serve
At first glance, calculating cost to serve may sound like an accounting task - but it’s really a
cross-functional analysis. You’re looking to capture the full journey of how your product or service gets into your customer’s hands, and what it costs at every step. Here’s how to approach it:
Start by identifying key cost drivers. Your product profile also influences many of these underlying costs. These might include transportation, warehousing, order fulfillment, customer service, returns processing, and sales support. Next, map these cost drivers across your supply chain touchpoints - think of every activity from the moment an order is placed to when it’s delivered and billed.
Once the cost elements are identified, allocate them to individual products, customers, or channels. This can be done using activity-based costing, which links specific costs to activities performed for each customer. Production capacity planning also benefits from this level of cost detail. Cost accounting methods can support more accurate allocation in this process. The more granular your data, the more accurate your analysis. Tracking inventory levels can also highlight cost disparities across channels.
Finally, use software tools or dashboards that can aggregate and analyze this data in real-time. Manual spreadsheets won’t cut it when you’re juggling thousands of orders and dozens of channels. With the right systems in place, your CTS analysis moves from a periodic audit to a continuous performance lever. It also provides early signals when frequent order changes inflate service costs.
Transforming Cost-To-Serve Analysis
Modern businesses are no longer treating cost to serve as a one-time report. They’re building dynamic, responsive systems that continuously track costs and fuel smarter decisions. Improving order management is often one of the first areas addressed Here’s how companies are transforming their approach to CTS:
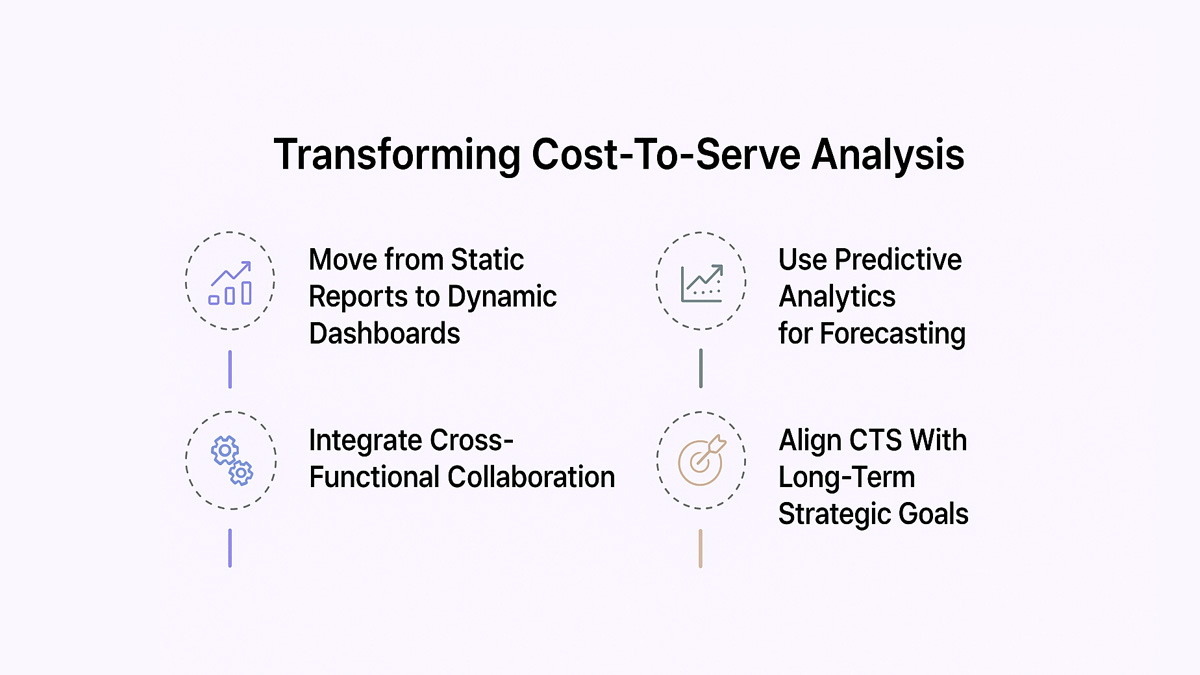
Move From Static Reports to Dynamic Dashboards
Traditional CTS models often rely on quarterly reports or Excel-heavy calculations. But in a world where customer behavior and supply chain conditions change rapidly, that’s not fast enough. Leading businesses are using live dashboards to monitor cost performance by customer or channel in real time - enabling faster course corrections. These dashboards can also flag issues with delivery commitments that impact cost. Tracking performance trends across time periods reveals deeper insights.
Use Predictive Analytics for Forecasting
Cost to serve isn’t just about backward-looking metrics. Predictive tools now help forecast future service costs based on order volume, delivery location, SKU complexity, or customer behavior. These predictive models reduce guesswork and improve planning accuracy. These forecasts can inform pricing models, route optimization, and even contract terms with customers. Sensitivity modelling can further test the impact of demand fluctuations. They also support smarter supply chain design for future scalability.
Integrate Cross-Functional Collaboration
Cost data lives across departments - sales, finance, procurement, operations - which means silos can ruin CTS accuracy. A modern cost-to-serve model encourages cross-functional ownership, with each team contributing inputs and taking shared accountability for profitability.
Align CTS With Long-Term Strategic Goals
When treated as a reactive tool, CTS becomes a cost-cutting exercise. But when aligned with long-term goals, it becomes a value creation tool. Businesses use CTS to justify investment in automation, to prioritize high-margin customers, or to build more resilient supplier networks. It also helps track long-term profitability trends across market segments. The key is tying CTS insights directly to strategic outcomes.
Common Pitfalls in Cost-To-Serve Analysis (And How To Avoid Them)
Cost-to-serve analysis is powerful - but only if it’s done right. Many businesses dive into it with good intentions, only to get stuck in complexity or misinterpret the results. Here are some of the most common mistakes, and how to sidestep them.
Overlooking Indirect Costs
It’s easy to track shipping or packaging, but what about the time your support team spends on high-maintenance clients? Or the extra handling steps for custom orders? Ignoring these soft costs creates blind spots that skew your analysis.
Using Static, Outdated Data
Relying on one-time snapshots or outdated reports is a recipe for poor decisions. Costs shift with time - fuel prices fluctuate, labor gets reprioritized, and customer behavior evolves. To stay relevant, your CTS model needs to be dynamic and regularly updated.
Not Aligning Teams Around Shared Metrics
Finance might see CTS one way, while operations or sales see another. If each team defines costs differently, your numbers won’t add up. Ensure cross-functional alignment on what’s being measured - and why.
Treating CTS as Just a Cost-Cutting Tool
This is perhaps the biggest trap. CTS isn’t only about trimming fat - it’s about reallocating resources toward the customers, channels, and services that actually drive value.
How Spendflo Helps With Cost-To-Serve Optimization
Spendflo plays a pivotal role in optimizing cost to serve by bringing full visibility into SaaS procurement, vendor contracts, and spend data - areas that often hide indirect costs. With our centralized dashboard, companies can track software usage, identify underutilized tools, and link software investments to actual business outcomes. By reducing redundant software, renegotiating smarter contracts, and aligning procurement with usage, Spendflo helps finance and procurement leaders cut down hidden costs and improve overall cost-to-serve efficiency - especially in digital operations.
Frequently Asked Questions on Cost to Serve Analysis
What is the difference between cost to serve and landed cost?
Landed cost refers to the total cost of a product until it reaches your warehouse - including duties, taxes, and shipping. Cost to serve goes further, capturing all costs involved in delivering the product to the customer, such as fulfillment, returns, support, and post-sale services.
How can small businesses use cost to serve effectively?
Even without complex software, small businesses can start by identifying their top cost drivers and mapping how much time, effort, and resources go into serving different customers. Tools like spreadsheets or basic dashboards can help until they’re ready to scale with more advanced systems.
What tools are best for cost to serve analysis?
Look for solutions that offer real-time data tracking, activity-based costing, and integration with procurement, finance, and CRM systems. Platforms like NetSuite, Coupa, and advanced BI tools (e.g., Power BI, Tableau) are commonly used. Spendflo complements these by optimizing software spend within your cost model.
Can cost to serve be automated?
Yes, many businesses automate CTS analysis by integrating procurement, finance, and operations data through ERP or spend management platforms. Automation reduces errors, speeds up reporting, and enables predictive modeling - transforming CTS from a static report into a strategic function.
How does cost-to-serve influence pricing strategy?
Understanding cost-to-serve helps companies set a pricing strategy that aligns with the true cost of serving individual customers. This ensures profit margins are protected even when serving high-cost customer segments.
Why is customer segmentation important in cost-to-serve analysis?
Customer segmentation helps identify which segments generate higher costs relative to revenue. By comparing profitability analysis across customer segments, businesses can prioritize high-value relationships more effectively.
How can businesses improve profit margins using cost-to-serve data?
By analyzing costs at the level of individual customers, businesses can identify unprofitable relationships and optimize services. This targeted approach helps refine pricing and service delivery to improve profit margins.


.png)
.png)