


Accounts Payable Automation: Cash Flow & Efficiency

.png)

Accounts Payable Automation: Cash Flow & Efficiency
Learn 3 proven methods to forecast accounts payable, overcome challenges, and streamline AP forecasting with automation for better cash flow control.

According to a Deloitte survey, 82% of CFOs say poor cash flow visibility limits their ability to plan for growth. Even the most profitable companies can stumble when they don’t have a clear picture of what’s going out and when.
Cash flow can make or break a business. Accounts payable (AP) sits right at the heart of it shaping how a company pays vendors, funds new initiatives, and stays stable. Getting AP forecasts right isn’t just smart finance; it’s what keeps a business running smoothly when things get unpredictable.
What is Accounts Payable Forecasting?
Accounts payable forecasting is the process of predicting future vendor payments based on past trends, payment terms, and upcoming expenses. It helps finance teams anticipate cash outflows, plan budgets, prevent liquidity issues, and maintain steady cash flow for better financial control.
AP vs. AR: Understanding the Working Capital Relationship
To manage cash effectively, finance teams need to balance what’s going out and what’s coming in. That’s where Accounts Payable (AP) and Accounts Receivable (AR) work hand in hand.
Why Is Accounts Payable Forecasting Difficult?
Forecasting accounts payable (AP) sounds simple, but in reality, it’s a complex process with many moving parts. Finance teams juggle changing vendor terms, manual inputs, and inconsistent data, all of which can distort projections and make cash flow planning harder than expected.
Lost or Incomplete Invoice Data
When invoices arrive late, go missing, or are logged inconsistently across departments, finance teams lose visibility into future payables. Lost open invoice data means payments can slip through the cracks, skewing forecasts and increasing the risk of short-term cash gaps.
Rising Costs and Variable Spending
An increase in the cost of goods sold (COGS) can quickly throw off predictions if not factored into AP models. Fluctuating supplier prices, seasonal demand, or unexpected expenses can all shift outgoing payments and reduce forecast accuracy.
Errors in Accounts Payable Data
Manual data entry remains a major source of forecasting errors. Errors in accounts payable data from typos to duplicate invoices can distort payable timelines and payment amounts. Over time, these discrepancies reduce confidence in forecasts and make it harder to plan working capital effectively.
Disconnected Systems
Without integration between AP, budgeting, and ERP tools, finance teams often rely on outdated spreadsheets and patchy reports. This lack of real-time visibility makes it harder to understand how payables align with budgets, upcoming purchases, or broader financial goals.
Benefits of Accounts Payable Forecasting
Strong accounts payable (AP) forecasting goes beyond predicting outgoing payments, it helps finance teams plan ahead, stay agile, and manage vendor relationships more effectively. Done right, it turns reactive cash management into a proactive strategy that benefits the entire organization.
Financial Benefits
Improved cash flow planning
Accurate forecasting gives finance teams visibility into upcoming expenses. This helps ensure enough funds are available for major payments while avoiding last-minute cash shortfalls.
Better working capital management
According to Brex and PLANERGY, maintaining an optimal cash balance through AP forecasting helps businesses stay liquid without tying up excessive reserves.
Cost savings from early payments
Forecasting enables teams to spot opportunities for early payment discounts offered by vendors, savings that add up quickly, as noted by Brex and Ramp.
Reduced late payments and penalties
HighRadius reports that anticipating payment due dates lowers the risk of late fees and helps maintain a clean payment record, supporting long-term vendor trust.
Strategic and Operational Benefits
Increased financial agility
With clear visibility into future payables, finance leaders can make quicker, data-backed decisions about investments, cost control, and payment timing, says HighRadius.
Stronger vendor relationships
Consistent, timely payments build reliability. Brex and SAP Taulia note that this strengthens supplier partnerships and improves negotiating power over time.
Improved operational efficiency
By reducing last-minute payment scrambles, companies can simplify their AP process and focus resources on strategic priorities, as highlighted by Brex.
Better interdepartmental coordination
HighRadius explains that accurate forecasts help finance, procurement, and AP teams align payment timing with purchasing capacity, ensuring everyone works from the same financial picture.
The 7 Methods to Forecast Accounts Payable
There’s no single formula for accurate accounts payable (AP) forecasting. The right method depends on your company’s size, industry, vendor relationships, and data maturity. Many finance teams use a mix of models to project payables with confidence. Below are seven reliable methods to consider for projecting accounts payable and improving cash flow visibility.
1. Historical Trend Analysis
This method looks at past payment patterns to forecast future obligations. By reviewing 6–12 months of invoices, you can identify recurring costs, seasonal peaks, and average payment timelines. It’s simple to execute and helps establish a solid baseline for expected outflows.
2. Cash Disbursement Modeling
Cash disbursement modeling projects payments based on upcoming purchases, vendor contracts, and planned expenses. It’s ideal for companies with predictable procurement cycles or long-term supplier agreements. By linking procurement and AP data, teams can model cash outflows more accurately.
3. Vendor-Centric Forecasting
This approach focuses on vendor-specific behaviors, terms, and payment history. Some suppliers may consistently offer early-payment discounts, while others impose strict deadlines. Incorporating these nuances improves forecast accuracy and supports stronger vendor relationships.
4. Regression Method
The regression method uses statistical analysis to forecast AP by examining relationships between variables, for instance, how changes in sales volume or production output affect payables. It’s data-driven and works best for organizations with strong analytics capabilities.
5. Percent of Sales Method
This straightforward approach assumes AP fluctuates in proportion to sales. If sales are projected to rise by 10%, AP is expected to increase by a similar percentage. The percent of sales method is useful for companies with stable expense-to-revenue ratios.
6. Industry Trends Method
The industry trends method benchmarks AP performance against broader market patterns. By analyzing sector-wide data on payment cycles, cost behavior, and supplier terms, finance teams can adjust forecasts to reflect external influences and economic shifts.
7. Hybrid Forecasting
Many businesses combine multiple methods for greater accuracy. For example, historical trend analysis might provide the base forecast, while regression models fine-tune it using current sales and cost data. This hybrid approach balances simplicity and precision.
Core Formulas for Accounts Payable Forecasting and Analysis
Accurate forecasting depends on understanding key accounts payable (AP) metrics. Two essential tools for any finance team are the Days Payable Outstanding (DPO) and the Accounts Payable Turnover Ratio (TAPT). Together, they show how efficiently your business manages outgoing payments and vendor relationships.
Days Payable Outstanding (DPO) Formula
The Days Payable Outstanding (DPO) Formula measures the average number of days a company takes to pay its suppliers. It helps evaluate how well a business manages its payables and cash flow.
DPO=Average Accounts PayableCost of Goods Sold (COGS)/365\text{DPO} = \frac{\text{Average Accounts Payable}}{\text{Cost of Goods Sold (COGS)} / 365}DPO=Cost of Goods Sold (COGS)/365Average Accounts Payable
How to interpret it:
- A higher DPO means the company is taking longer to pay suppliers, conserving cash but potentially straining vendor relationships.
- A lower DPO indicates faster payments, improving supplier trust but tightening cash availability.
Accounts Payable Turnover Ratio (TAPT Formula)
The Accounts Payable Turnover Ratio (TAPT) measures how many times a company pays off its accounts payable during a given period. It reflects payment efficiency.
TAPT=Total Supplier Purchases or COGSAverage Accounts Payable\text{TAPT} = \frac{\text{Total Supplier Purchases or COGS}}{\text{Average Accounts Payable}}TAPT=Average Accounts PayableTotal Supplier Purchases or COGS
How to interpret it:
- A high TAPT suggests quick supplier payments and strong liquidity.
- A low TAPT may indicate delays or inefficient AP management.
Balance Sheet Calculation Example: Using DPO to Forecast Period-End AP
Example:
A company reports:
- Cost of Goods Sold (COGS): $900,000
- Days Payable Outstanding (DPO): 45 days
To calculate accounts payable at period-end:
Accounts Payable=COGS365×DPO\text{Accounts Payable} = \frac{\text{COGS}}{365} \times \text{DPO}Accounts Payable=365COGS×DPO Accounts
Payable=900,000365×45=110,959\text{Accounts Payable} = \frac{900,000}{365} \times 45 = 110,959Accounts Payable=365900,000×45=110,959
Result: The projected period-end AP balance is approximately $111,000.
This Balance Sheet Calculation Example shows how DPO links expense timing to cash flow. By tracking both DPO and TAPT, finance teams can spot trends, improve working capital forecasting, and refine vendor payment strategies.
How to Forecast Accounts Payable
Forecasting accounts payable (AP) helps finance teams anticipate upcoming cash outflows and plan working capital effectively. The process combines data analysis, formulas, and ongoing adjustments to ensure accuracy as business conditions change.
1. Analyze Historical Data and Spending Patterns
Start by reviewing past vendor payments and invoices to identify trends. Look for seasonal fluctuations, recurring expenses, and average payment cycles.
- Review past payments: Examine 6–12 months of data to spot consistent patterns or cost spikes.
- Identify commitments: Check your balance sheet and supplier contracts for future expenses like subscriptions, renewals, or large one-time purchases.
2. Use the Days Payable Outstanding (DPO) Formula
The Days Payable Outstanding (DPO) metric shows how long your company takes to pay suppliers. It’s a key part of short-term cash flow forecasting.
DPO=(Average Accounts Payable×365)Cost of Goods SoldDPO = \frac{(Average \, Accounts \, Payable \times 365)}{Cost \, of \, Goods \, Sold}DPO=CostofGoodsSold(AverageAccountsPayable×365)
Once you have your DPO, you can calculate forecasted accounts payable using this related formula:
Forecasted AP=(DPO×COGS)365Forecasted \, AP = \frac{(DPO \times COGS)}{365}ForecastedAP=365(DPO×COGS)
This helps estimate your projected payables for the next period based on current business activity.
3. Incorporate Other Factors
AP forecasting isn’t just about math, external factors play a big role.
- Adjust for seasonality: Account for busy periods, such as year-end purchases or renewal cycles, that increase outgoing payments.
- Integrate future commitments: Include expected purchases, upcoming contracts, or purchase orders that haven’t yet been invoiced to get a full picture of obligations.
4. Refine and Update Regularly
Accurate forecasting requires continuous improvement.
- Review and adjust: Compare actual payments against your forecast to identify gaps and refine your model.
- Leverage technology: Use accounting or procurement software to automate calculations, track vendor terms, and update forecasts in real time.
Forecasting Accounts Payable on the Balance Sheet
Accounts payable (AP) appears under current liabilities on the balance sheet because it represents short-term obligations, the amounts a company owes to suppliers for goods and services received but not yet paid for. Since these payments are typically due within a year, AP directly affects short-term liquidity and working capital.
When you forecast accounts payable on the balance sheet, you’re estimating what your outstanding vendor payments will look like at the end of a future period. This is essential in financial modeling, as it ensures projected expenses and cash flow align with business growth assumptions.
Using the Percent of Sales Method
The Percent of Sales Method is the most common way to project accounts payable. It assumes that AP moves in proportion to sales, meaning, as sales increase, payables typically rise to support the higher level of operations.
Formula: Forecasted Accounts Payable=(Historical AP ÷ Historical Sales)×Projected SalesForecasted \, Accounts \, Payable = (Historical \, AP \, ÷ \, Historical \, Sales) \times Projected \, SalesForecastedAccountsPayable=(HistoricalAP÷HistoricalSales)×ProjectedSales
Example: If a company’s historical AP is $200,000 and its annual sales were $2,000,000, then AP equals 10% of sales.
If projected sales for the next year are $2,400,000, the forecasted accounts payable would be:
Forecasted AP=10%×2,400,000=240,000Forecasted \, AP = 10\% \times 2,400,000 = 240,000ForecastedAP=10%×2,400,000=240,000
Why It Matters
This simple approach ties AP directly to the scale of operations. It helps finance teams:
- Anticipate how growth will impact current liabilities
- Align procurement and payment strategies with sales forecasts
- Maintain balanced working capital projections in broader financial models
Best Practices To Improve AP Forecasting
Forecasting accounts payable isn’t just about crunching data. External influences and business dynamics often shape payment timing in ways spreadsheets can’t capture. Here are key factors to weigh alongside the numbers:
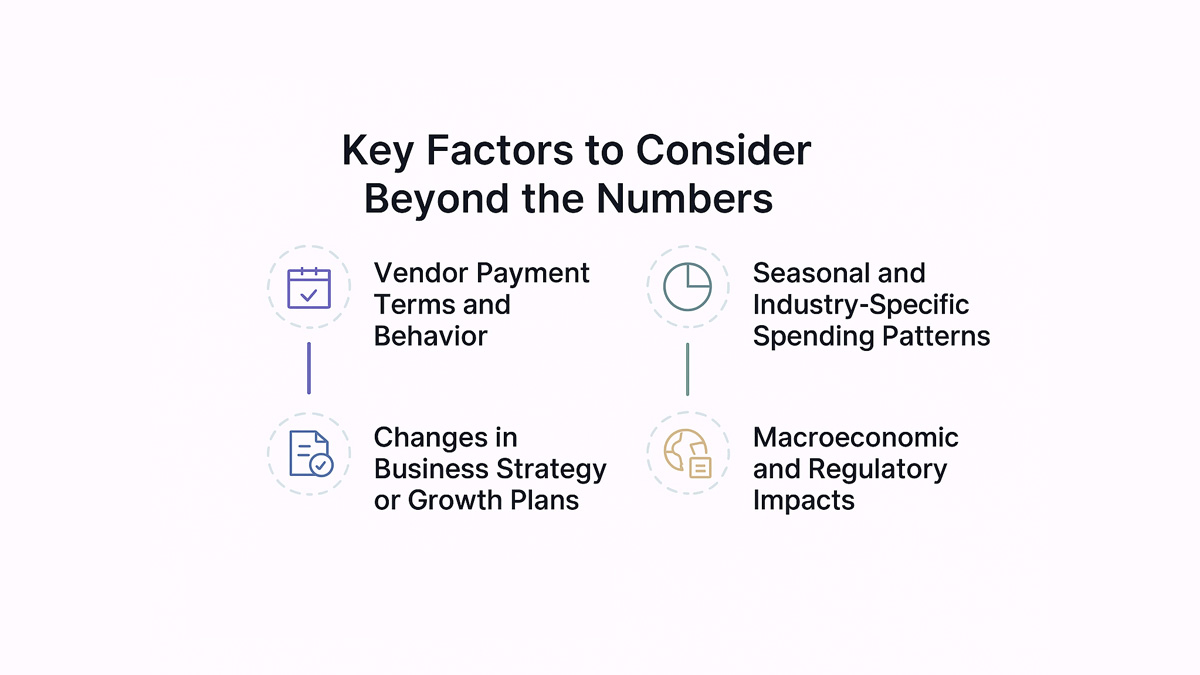
Vendor Payment Terms and Behavior
Every vendor has its quirks. Some may consistently offer early payment discounts, while others extend flexible credit. Understanding not just the terms on paper but how vendors behave in practice helps finance teams refine their forecasts.
Seasonal and Industry-Specific Spending Patterns
Retailers may see heavy outflows before holiday seasons, while manufacturers might pay more during raw material surges. Tracking average days payable ensures seasonal impacts don’t disrupt cash flow stability. These cycles aren’t visible in averages but have a major impact on actual cash flow.
Changes in Business Strategy or Growth Plans
Expansion into new markets, hiring sprees, or a pivot in product strategy can quickly alter payable patterns. Forecasts that ignore these shifts risk being outdated the moment plans change.
Macroeconomic and Regulatory Impacts
Inflation, interest rate changes, or new compliance rules can ripple through vendor pricing and payment schedules. Staying alert to these external forces ensures forecasts reflect not just internal plans but the broader environment. Fluctuations in cost of goods sold can also influence payables and must be factored in.
How Automation Streamlines AP Forecasting
Manual forecasting often feels like trying to hit a moving target. Invoices come in late, approval chains drag on, and mismatched spreadsheets lead to conflicting numbers. Automation takes much of that uncertainty out of the picture by standardizing how payables are tracked, processed, and reported.
Centralized Invoice Management
With automation, all invoices flow into one platform instead of being scattered across emails, paper files, or separate systems. This central hub gives finance teams immediate visibility into pending obligations. Instead of waiting for monthly reconciliations, they can see liabilities in real time and adjust forecasts before problems snowball.
Built-In Approval Workflows
Slow approvals can make forecasting unreliable. Automated systems streamline routing, reminders, and sign-offs, ensuring invoices are approved quickly and consistently. This consistency reduces missed invoice payments and strengthens forecast reliability. This predictability helps teams estimate not just how much cash will leave, but also when it will leave, closing the gap between planned and actual outflows. Comparing forecasts against average accounts values gives an added accuracy check.
Integration With ERP and Budgeting Tools
Automation shines when it doesn’t work in isolation. Linking AP software with ERP, procurement, and cash management tools creates a unified financial picture. Forecasts no longer sit as static spreadsheets, they update dynamically alongside budgets, procurement plans, and overall cash flow projections. This integration enhances financial forecasting as a whole, not just AP.
Data-Driven Insights and Alerts
Modern AP automation doesn’t just capture data, it interprets it. Systems can flag unusual payment trends, highlight seasonal spikes, or suggest optimal timing for disbursements. Factoring in each vendor’s preferred payment method adds realism to forecasts. This proactive layer helps businesses avoid liquidity crunches and seize opportunities to optimize working capital. More accurate forecasting translates directly into better financial planning and fewer surprises. These insights also strengthen the financial model companies rely on for long-term planning. Strong supplier relationships are also easier to maintain when forecasts are dependable. Reliable forecasting builds trust and strengthens each business relationship in the vendor network.
By removing bottlenecks and weaving AP into broader financial systems, automation transforms forecasting from a reactive task into a reliable, strategic function.
How Spendflo Helps With Accounts Payable Forecasting
Accurate AP forecasting can make the difference between a smooth quarter and a last-minute scramble for cash. Many finance teams still rely on scattered spreadsheets and incomplete vendor data, which makes every forecast a guessing game.
One of Spendflo’s clients, a mid-market SaaS company, faced this same challenge: missed renewal dates and inconsistent payment terms were causing surprise expenses each month. After moving to Spendflo, they centralized contracts, automated approvals, and cut payment delays by 40%. That visibility gave their CFO the control needed to plan cash flow with confidence. If your forecasts still depend on manual reports and disconnected tools, it’s time to fix the root problem.
Spendflo brings your vendor data, contracts, and forecasts together in one AI-powered platform so you can forecast with accuracy and act with certainty.
Book a demo today and see how much easier AP forecasting can be.
Frequently Asked Questions on Cash Flow and Accounts Payable
What is the role of accounts payable in cash flow forecasting?
Accounts payable directly affects outgoing cash, making it a critical piece of forecasting. By predicting when payments will be made, companies can anticipate liquidity needs, plan working capital, and avoid shortfalls.
How often should AP forecasts be updated?
Ideally, forecasts should be refreshed at least monthly. However, businesses with high transaction volumes or seasonal swings may benefit from weekly updates to stay aligned with real-time cash flow movements.
Can AP forecasting prevent late payments or missed discounts?
Yes. By mapping due dates and vendor terms into forecasts, businesses can schedule payments strategically. This helps avoid late fees, capture early-payment discounts, and maintain strong vendor relationships. Avoiding late payment penalties also preserves both liquidity and reputation.
What software tools are best for automating AP forecasts?
Procurement and AP automation platforms, especially those that integrate with ERP systems, work best. Tools like Spendflo centralize invoices, vendor terms, and renewals, giving finance teams accurate, up-to-date forecasts without manual effort.


.png)
.png)