


SaaS procurement is often complicated due to lengthy cycles, hidden costs, and unclear pricing. These unpredictable expenses and extended negotiations drain valuable time and resources away from core business operations.
This triggers an urgent necessity of a more effective and transparent system of analyzing the existing contracts and making the future purchases. To gather information throughout its supply chain, forward-looking companies are turning to tech-enabled procurement. Although the collection of data plays a crucial role in the construction of strategies, it is not the end, companies have to employ analytics to transform raw numbers into actionable responses.
As Carly Fiorina, former HP CEO, once said:
The goal is to turn data into information, and information into insight.
Procurement analytics is the process of interpreting procurement data to achieve specific business goals. In this guide, we’ll introduce the concept, explain its importance, and highlight key KPIs every procurement leader should track.
What is Procurement Analytics?
Procurement analytics is the practice of collecting and analyzing data from across the procurement cycle supplier performance analytics, contract terms, purchase orders, invoices, and internal systems to generate actionable insights. Instead of relying on fragmented reports, analytics gives finance and procurement leaders a unified view of spend.
These insights power better decision-making in real time: helping teams evaluate vendors, spot inefficiencies, negotiate stronger contracts, and reduce procurement risks. When applied consistently, procurement analytics not only improves day-to-day purchasing but also drives long-term savings, compliance, and operational efficiency.
Why Procurement Analytics Is Important?
Procurement analytics isn’t just about tracking expenses, it's about giving finance and procurement teams the clarity they need to make smarter decisions. When businesses rely on spreadsheets or fragmented systems, they lose visibility into where money is going and whether vendors are delivering real value. That lack of visibility leads to overspending, compliance risks, and missed opportunities for savings.
Here’s why procurement analytics matters for growing organizations:
1. Cost savings with confidence
Analytics highlight duplicate tools, unused licenses, and overpriced contracts so you can eliminate waste and negotiate better deals. They also quantify commit utilization and seat adoption, helping you right-size tiers before renewal and prevent shelfware at purchase.
2. Stronger vendor negotiations
With pricing benchmarks and usage data on hand, you walk into renewal discussions prepared and in control. You can set renewal caps, trade term/ramp for price, and backstop positions with apples-to-apples benchmark bands.
3. Better compliance and risk management
Analytics track vendor performance and flag potential issues before they escalate into costly risks. Evidence is mapped to controls (e.g., SOC/ISO, DPA), with automated alerts and an audit trail that speeds reviews.
4. Forecasting and budget accuracy
Clear purchase analytics help finance leaders forecast renewals, plan budgets more accurately, and avoid last-minute surprises. Renewal runway views (90/60/30) and scenario models (price caps, headcount changes) tighten accruals and cash planning.
5. Efficiency and time back
Instead of digging through contracts and approvals manually, teams get procurement dashboards that surface the right information instantly. A single source of truth reduces cycle time, enables self-serve answers, and frees ops to focus on higher-value work.
Procurement Analytics vs Procurement Reporting
While they may sound similar, procurement analytics and procurement reporting serve different purposes. Here’s a quick breakdown:
How Procurement Analytics Works?
Procurement analytics takes raw spend data and turns it into practical insights that finance and procurement teams can use every day. Here’s how the process works:
1. Data Collection
Information is gathered from multiple sources invoices, contracts, purchase orders, SaaS usage reports, and vendor records. This ensures you capture the full picture of organizational spend.
2. Data Cleansing
Raw data often comes with duplicates, errors, or missing fields. Cleansing standardizes vendor names, corrects inaccuracies, and ensures consistency so the numbers you rely on are trustworthy.
3. Data Integration
Clean data is then combined into a central system or dashboard. Instead of jumping between spreadsheets and tools, teams get one consolidated view of all procurement activity.
4. Data Visualization
Dashboards and charts transform rows of numbers into easy-to-read visuals. Leaders can instantly see where money is going, how vendors are performing, and which contracts are up for renewal.
5. Data Analysis
Finally, advanced analytics often powered by AI uncover trends, highlight savings opportunities, and even forecast future spend. This step turns static data into actionable strategies.
Procurement Analysis Methods
Procurement analytics uses different methods to make sense of spend data. Each approach highlights opportunities to save costs, reduce risks, or strengthen supplier relationships. Here are the most common methods:
1. Category Profiling
This involves grouping purchases into categories such as IT, SaaS, or office supplies to see where most of the budget is going. Category profiling helps leaders prioritize high-spend areas for optimization.
2. Pareto Analysis (80/20 Rule)
The Pareto principle suggests that 80% of spend often comes from 20% of vendors. By identifying that critical 20%, procurement teams can focus on negotiating better contracts and consolidating vendors.
3. Spend Cube Analysis
This method looks at spend across three dimensions: supplier, category, and business unit. The “cube” format helps uncover overlaps, inefficiencies, and opportunities for savings that aren’t visible in traditional reports.
4. Supplier Segmentation (Kraljic Matrix)
Using the Kraljic matrix, suppliers are segmented based on their impact on the business and the risk of supply disruption. This helps determine which vendors are strategic partners versus transactional suppliers.
5. Supplier Preference Modeling
This analysis evaluates how suppliers view your organization as a customer high priority, mid-level, or low. Understanding this preference allows procurement teams to anticipate vendor behavior and strengthen strategic partnerships.
4 Types Of Procurement Analytics
Procurement analytics isn’t just about tracking spend it applies different methods of analysis to provide insights at various stages of decision-making. These can be grouped into four types:
1. Descriptive Analytics
Analyzes past procurement activities using historical data.
- Example: Checking the previous vendor performance, compliance with contracts, and by category spending.
- Advantage: Provides procurement heads with an insight into purchasing trends and areas of inefficiency.
2. Diagnostic Analytics
Explains why procurement problems occurred by identifying root causes.
- Example: Finding out why supply lead times were higher or why there was a budget variance.
- Advantage: Assists in determining the underlying causes like supplier reliability, mismanagement of contract or spikes in demand.
3. Predictive Analytics
Uses data models and forecasting to show what is likely to happen next.
- Example: Forecasting price increases in SaaS renewals or predicting supplier delivery delays based on historical trends.
- Benefit: Enables proactive planning and negotiation strategies.
4. Prescriptive Analytics
Recommends what should be done by providing actionable insights and optimal decisions.
- Example: Suggesting which SaaS contracts to consolidate, which vendors to renegotiate with, or how to balance inventory levels.
- Benefit: Turns data into strategy, guiding procurement teams toward the most cost-effective and low-risk actions.
Challenges of Procurement Analytics
Procurement analytics has the power to transform how organizations manage spend, but getting there isn’t always straightforward. Many companies run into roadblocks that slow down adoption or limit results. Here are the key challenges to watch for:
1. Data quality issues
Procurement data often comes from different sources: invoices, ERP systems, SaaS platforms, and manual spreadsheets. If that data is inconsistent, duplicated, or incomplete, the insights will be flawed. Poor data quality is one of the biggest barriers to meaningful procurement data analysis.
2. Change management
Introducing analytics requires a cultural shift. Teams used to making decisions based on gut instinct or legacy processes may resist moving to a data-driven approach. Training, communication, and leadership support are critical to ease this transition.
3. Resource constraints
Building a strong analytics function takes time, skilled people, and the right technology. Smaller procurement and finance teams often struggle to allocate resources, leaving analytics underdeveloped or inconsistent.
4. Integration complexities
Procurement data rarely lives in one place. It’s usually spread across ERPs, contract repositories, SaaS usage tools, and vendor portals. Connecting these systems into a unified view for spend analytics can be technically complex and time-consuming.
5. Choosing the right metrics
Not every data point is worth tracking. Without a clear strategy, teams risk measuring too much or focusing on metrics that don’t drive outcomes. Identifying the right KPIs like supplier performance analytics, cost savings, or compliance rates ensures analytics stay actionable.
6. Data privacy and security concerns
Procurement data includes sensitive financial and vendor details. Any analytics initiative must comply with data protection standards like SOC 2, ISO 27001, GDPR, and CCPA. Failing to prioritize privacy and security can undermine trust and expose organizations to regulatory risks.
Data Sources for Procurement Analytics
The precision and effectiveness of procurement analytics depend on the quality of data it uses.These data sources may be divided into two broad categories internal (in the organization) and external (outside market and supplier data).
1. Internal Data Sources
- Purchase Orders (POs) - Documentation of all the accepted purchases orders such as cost, quantity and schedule.
- Invoices- Supplier billing data that aids in monitoring payment terms, variances and compliance.
- Contracts and Renewal Data - The information on the agreed pricing, SLAs, renewal schedule, and negotiated terms.
- Accounts Payable Records - Payments, outstanding and cash flow are affected.
- ERP/Finance Systems Central financial data, budgets and expense allocations.
- SaaS Usage Data License usage, log-ins, and feature adoption by application.
- Inventory and Warehouse Information Stock, carrying cost, storage cost and shrinkage/losses.
- Supplier Performance Records- On time deliveries, rejections, dispute records and compliance audits.
- Expense Reporting Data & Credit Card Data -Unauthorized SaaS or vendor purchases by employees (shadow IT).
2. External Data Sources
- Supplier Price Lists and Catalogs - Direct quotes on the market rates and products availability with the vendors.
- Benchmarking Databases Industry standard price, expenditure benchmarks, and performance.
- Third-Party Risk Databases Vendor credit ratings, compliance certifications, and security risk information.
- Market Price Indexes SaaS market price, commodity, and exchange rates.
- Industry Report (Gartner, Deloitte, etc.) – Information about procurement trends, SaaS implementation, and ROI rate.
- Regulatory Data - The regulatory requirements (GDPR, SOC 2, ISO 27001) that influence the qualification of the vendors.
- Geopolitical/ Environmental Data- Data on disruptions such as wars, natural disasters or pandemics.
- Peer Reviews and Analyst Reports- Reviews of other organizations on reliability and performance of a vendor.
- Contractor and Supplier Networks - Wider supplier ecosystems that disclose the risks of fourth- party or subcontractor.
.png)
Benefits of procurement analytics
Procurement analytics can initially seem complex to managers due to varying data types and impacts across industries. However, its benefits are widely recognized and consistent across different sectors:
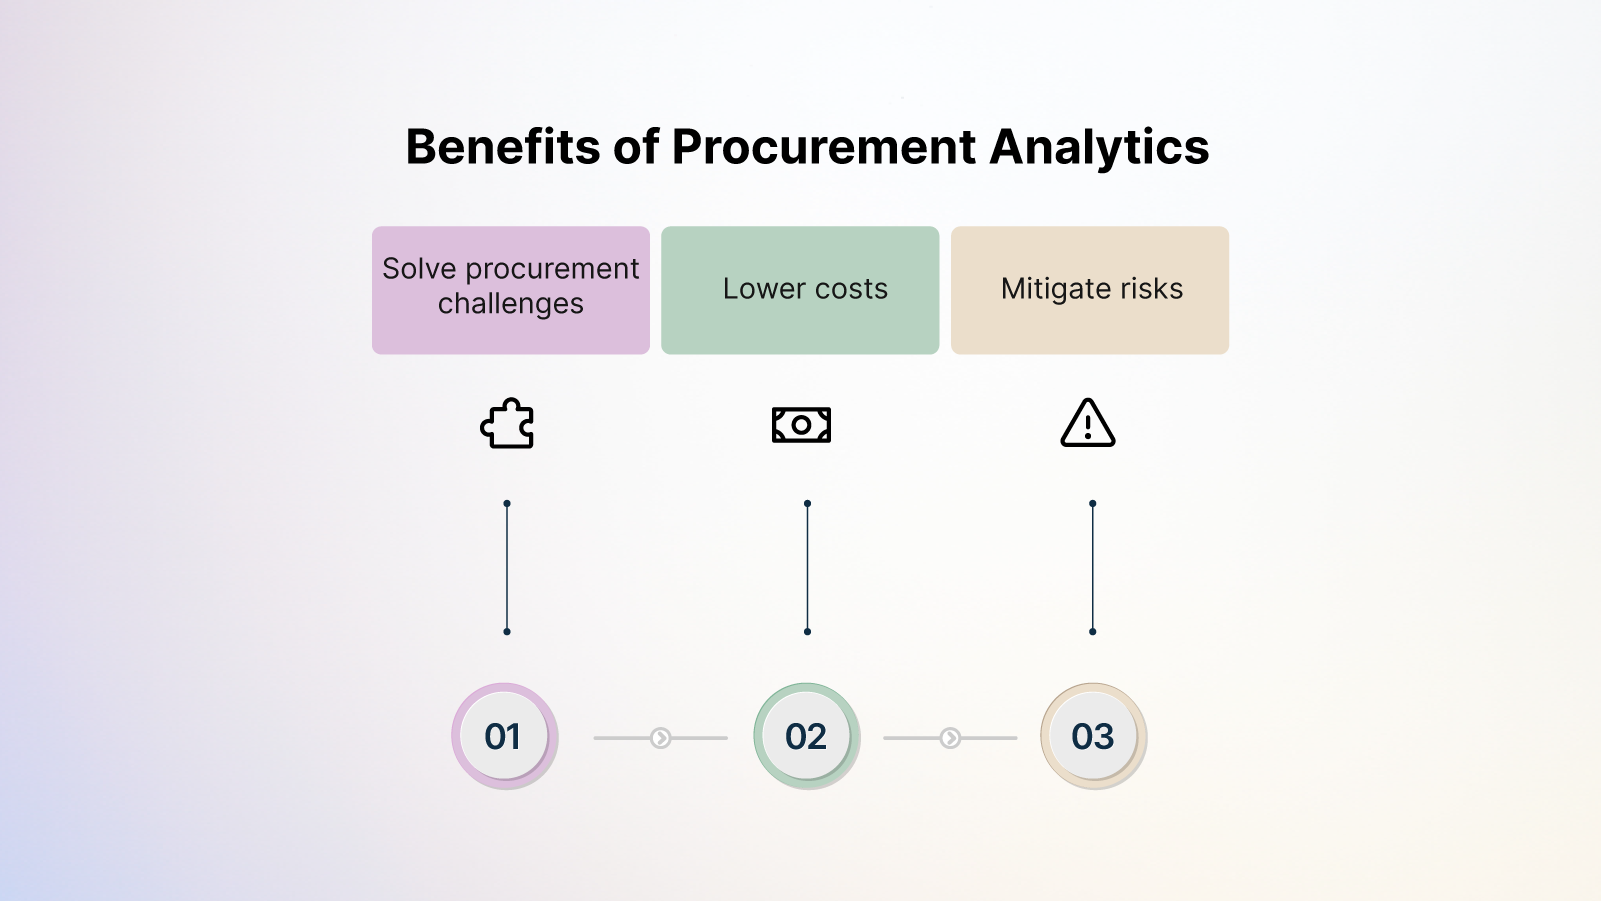
A) Solve procurement challenges
Procurement analytics enables a team to address sourcing, purchasing and accounts payable challenges before they cause a disruption in the supply chain. With historical data, market references, and foresight, procurement leaders can fix the inefficiencies at an early stage and create enhanced collaboration, shorter lead times, and lower costs throughout the organization.
Deloitte Global Chief Procurement Officer (CPO) Survey shows that high performing procurement organizations apply advanced analytics to enhance decision-making, with 62% of such companies doing so, as opposed to 27% of their peers. This shows why it is quantifiable that analytics be incorporated in procurement operations.
Procurement challenges solved by analytics.
1. Vendor Commercial and Procurement.
Analytics is used to compare previous performance of vendors and their prices, as well as, market trends to allow procurement to select good suppliers. This avoids wastage and minimizes risks associated with low quality of vendors.
2. Cost Excess and Budget Management.
With the ability to monitor the real expenditure versus the budgets, analytics helps in quick detection of variances and gives visibility of cost drivers. This guarantees superior predictions and discipline of the budgets.
3. Contract and Renewal Management.
Analytics point out under-utilized licenses, duplicate contracts and renewals. This will avoid last-minute renewal at high costs and enhance the success of negotiations.
4. Supplier Lead Times
With the help of the analysis of the delivery tendencies, the procurement will be able to find vendors that delay constantly and make certain alternatives. This will provide a smoother planning of production and eliminate bottlenecks.
5. Paying accounts Inefficiencies.
Analytics can detect invoice errors, overdue payments, or irregularities in accounts payable leading to faster payments and stronger supplier relationships.
6. Supply Chain Risk
Geopolitical, financial or operational factors can be monitored and analyzed using data, which allows procurement to become diversified and reduce its reliance on high-risk suppliers.
7. Inventory Management
The procurement analytics will offer demand forecasting and consumption trends that will assist in maintaining optimal inventory levels and reduce carrying costs.
B) Lower costs
The Procurement leaders are subject to constant pressure of meeting the cost control demands and getting value out of the vendors. Using solutions, such as Spend Analytics, teams will have a profound insight into spending trends, compare prices to industry rates, and enter smarter contracts.
Case Study: How Spendflo Reduced SaaS Costs for a High-Growth Tech Company
One of the rapidly expanding SaaS companies chose Spendflo to manage its vendor expenses. Within the first year:
- Saving of costs through optimization of SaaS licenses and renegotiations with the vendors amounted to 375,000.
- The contract leakage was minimized 40% as Spendflo found a difference between contracted value and real usage.
- More than 100 SaaS applications were merged, which removed duplicate applications and shadow IT.
C) Mitigate risks
The whole supply chain, inclusive of delays in deliveries and compliance problems can be destabilized by unparalleled dangers. Procurement analytics makes the spend data transparent and provides the data on vendor performance metrics, including delivery times, acceptance rates and rejection rates. This assists the procurement managers to filter and eliminate vendors with poor performance as well as establish trustworthy alliances.
These are the major kinds of risks that procurement analytics can help in alleviating:
1. Supplier Performance Risk
The failure of vendors to meet deadlines during delivery or deliver goods of poor quality is able to derail projects. Models identify such patterns at the initial stage to help the procurement teams to change the suppliers to more credible ones.
2. Financial Risk
Sellers with unstable economic conditions might default their obligation. Procurement analytics allows the monitoring of cost trends and contract adherence to alert of financial distress before it turns into an issue.
3. Compliance and Regulatory Risk
Failure to adhere to regulations or contractual provisions may cause fines and publicity. Analytics also provides a view on the compliance to contracts, certifications, and audit trails.
4. Operational Risk
There are unexpected upheavals like strike, lack of labor supply or unexpected capacity constraints which can stop the operations. The tracking of trends in the performance of the supplier assists procurement to plan the alternatives.
5. Supply Chain Disruption Risk
Suppliers in a certain region can be affected by events such as geopolitical tensions, natural disasters or pandemics. Analytics will diversify the vendors, and there will not be a dependency on one supplier or region.
6. Reputation Risk
Collaboration with vendors associated with unethical business can harm the brand image. The analytics of procurement gives a more accurate insight into the history of the vendor and compliance and makes sure that it complies with corporate values.
What Does a Procurement Analyst Do?
A procurement analyst plays a critical role in helping organizations manage spending more effectively. Their job is to turn raw procurement data into meaningful insights that guide smarter decisions. While titles may vary across companies, the core responsibilities usually include:
1. Data management and reporting
Collecting and organizing data from contracts, invoices, purchase orders, and SaaS tools to ensure leaders have accurate, real-time visibility into spend.
2. Spend analysis
Identifying cost-saving opportunities by analyzing categories of spend, vendor performance, and contract terms. This often includes spotting duplicate tools or underused licenses.
3. Supplier evaluation
Assessing supplier reliability, compliance, and pricing competitiveness to help the business negotiate stronger contracts and minimize risks.
4. Forecasting and budgeting
Supporting finance teams by forecasting renewals, modeling cost scenarios, and ensuring budgets reflect actual procurement needs.
5. Process improvement
Recommending ways to streamline procurement workflows, reduce manual work, and improve policy compliance.
Procurement Analytics Tools
Procurement analytics can be powered by different types of tools, depending on the depth of analysis and automation required. Broadly, these fall into three categories: Business Intelligence (BI) tools, dedicated procurement software, and AI-driven platforms.
1. Business Intelligence (BI) Tools
General purpose platforms like Tableau, Power BI, or Qlik which consolidate procurement data collected by various sources and visualize it.
- Strengths: Resourceful dashboards, data visualization, finance/ERP system integration.
- Limitations: Data must be prepared by hand, it is not designed to support procurement processes.
2. Dedicated Procurement Software
Solutions like Coupa, Ariba, or Jaggaer designed for procurement operations.
- Strengths: End-to-end procure-to-pay (P2P), contract management, compliance monitoring, and spend control.
- Limitations: Can be complex to implement, require training, and may not optimize SaaS-specific spend.
3. AI-Powered Procurement Platforms
Next-gen apps, such as Spendflo, which involves analytics, automation, and expert services.
- Strengths: Live spend analysis, vendor benchmarking, automated renewal alerts, SaaS license optimization, and built-in negotiation support.
- Limitations: Only works well with SaaS-intensive businesses and mid-to-large enterprises.
Tool Comparison Table
Here’s a visual-style chart comparing the three categories:
How To Choose the Right Procurement Analytics Software?
The market is crowded with analytics platforms, but not every tool fits the needs of finance and procurement teams. Choosing the right software means balancing functionality, usability, and long-term value. Here’s how to evaluate your options:
A) Key Selection Criteria
1. Data integration
The platform should connect seamlessly with your ERP, finance systems, SaaS tools, and vendor databases to give you a single source of truth.
2. Analytics capabilities
Look for advanced features such as predictive modeling, AI-powered recommendations, and supplier segmentation. These go beyond basic reporting and deliver actionable insights.
3. Ease of use
Dashboards must be intuitive, customizable, and accessible to both procurement specialists and business leaders. A tool that requires constant IT support will limit adoption.
4. Security and compliance
Procurement data is sensitive. Ensure the platform is SOC 2, ISO 27001, GDPR, or CCPA compliant to meet global data protection standards.
5. Scalability
The software should grow with your organization supporting more vendors, larger datasets, and more complex procurement processes over time.
6. Support and services
White-glove onboarding, training, and ongoing vendor support make adoption smoother and increase ROI.
B) Evaluation Frameworks
1. Weighted Scoring Model
Assign weights to factors like cost, integrations, analytics depth, and usability. This helps compare vendors objectively instead of relying on gut instinct.
2. Proof of Concept (POC)
Run a limited pilot with your shortlisted tools. A hands-on test reveals how well each solution fits your workflows and data challenges.
3. Total Cost of Ownership (TCO)
Look beyond license fees. Factor in implementation, training, support, and potential savings the tool will unlock.
Procurement Metrics and KPIs to Track
Procurement teams use KPIs to measure how well they’re driving savings, efficiency, compliance, and supplier performance. While specific procurement KPIs vary by industry and organizational goals, there’s a common set that most leading teams monitor. Grouped into five categories Cost, Quality, Speed, Risk, and Compliance here are the metrics that matter most:
A) Cost-Related KPIs
1. Spend vs Budget
Tracks how closely actual procurement spending aligns with the planned budget. Smaller variances signal stronger forecasting and discipline.
2. Spend Under Management
Measures the portion of total spend managed by procurement. Higher numbers indicate more control over costs.
3. Purchase Price Variance (PPV)
Compares expected (normative) prices with actual prices paid. Lower variance reflects stronger supplier negotiation.
4. Price Competitiveness
Assesses whether suppliers’ prices are aligned with market standards, factoring in logistics and maintenance.
5. Inventory Carrying Cost
Captures costs like rent, salaries, utilities, and shrinkage tied to holding inventory. Keeping this lean frees up working capital.
6. Total Cost of Ownership (TCO)
Goes beyond purchase price to include maintenance, support, and disposal costs over the lifecycle of goods or services.
7. Cost Avoidance
Focuses on preventing unplanned expenses (e.g., locking in fixed pricing to avoid currency swings, or pre-negotiating with alternate vendors).
8. Negotiation Cost Savings
Calculates the gap between supplier quotes and final negotiated prices, showing direct procurement impact.
B) Quality-Related KPIs
1. Supplier Compliance Rate
Tracks how often suppliers meet agreed terms on price, quality, and delivery timelines.
2. Vendor Accountability
Measures how quickly and effectively suppliers address issues, from delayed shipments to quality failures.
3. Contract Coverage
Evaluates what percentage of spend is governed by formal, enforceable contracts, reducing reliance on informal agreements.
C) Speed-Related KPIs
1. Procurement Cycle Time
The average time it takes to convert a requisition into a purchase order. Shorter cycles signal process efficiency.
2. Supplier Lead Time
Tracks how long it takes a supplier to deliver once an order is placed. Faster times boost agility.
D) Risk-Related KPIs
1. Exchange Rate Exposure
Monitors how currency fluctuations affect international supplier costs. Mitigation often comes from fixed-price contracts or supplier diversification.
2. Procurement ROI
Compares savings generated by procurement to the costs of running the function. World-class teams often target a 3x ROI or more.
E) Compliance-Related KPIs
1. PO Compliance Rate
Measures the percentage of purchases backed by approved purchase orders, helping ensure spend visibility and policy adherence.
2. Average Payment Term
Tracks the average number of days taken to pay supplier invoices. Aligning payment terms with receivables improves cash flow stability.
Technologies Enabling Procurement Analytics
Modern procurement analytics goes far beyond spreadsheets and static reports. Today, advanced technologies allow finance and procurement teams to extract deeper insights and act faster. Some of the most impactful include:
1. Machine Learning Applications
Machine learning models can process massive volumes of procurement data to detect spending patterns, spot anomalies, and even recommend cost-saving actions. This helps teams move from manual review to intelligent automation.
2. AI-Powered Insights
Artificial intelligence turns raw data into clear recommendations. From highlighting duplicate SaaS subscriptions to suggesting negotiation strategies, AI gives procurement teams a decision-ready view of their spend.
3. Predictive Modeling
Predictive analytics uses historical data to forecast future outcomes, such as upcoming renewals, potential budget overruns, or vendor risks. This forward-looking view allows leaders to plan ahead instead of reacting at the last minute.
4. Spend Cube Analysis
With spend cube analysis, data is broken down across three dimensions: supplier, category, and business unit. When paired with AI, this method helps uncover hidden overlaps, inefficiencies, and opportunities for consolidation.
5. Supplier Segmentation (Kraljic Matrix)
Technology makes it easier to apply frameworks like the Kraljic matrix at scale. By automatically classifying suppliers based on risk and business impact, procurement teams can focus their energy on strategic vendors while optimizing lower-value relationships.
Implementing Procurement Analytics : Step-by-Step
Adopting procurement analytics is more than installing a dashboard; it's about setting up the right foundation, choosing the right features, and preparing your team for change. Here’s how organizations can get started:
1. Define objectives
Clarify what you want from procurement analytics: cost savings, compliance tracking, vendor performance, or all of the above. Clear goals help shape the system you need.
2. Audit existing data
Review current spend data sources invoices, purchase orders, SaaS platforms, ERPs. Identify gaps, duplication, and inconsistencies that need to be cleaned before integration.
3. Select the right platform
Evaluate procurement analytics solutions based on your goals. Look for centralized dashboards, AI-powered analysis, and integrations with existing systems.
4. Integrate data sources
Connect procurement data across finance, SaaS, and vendor systems. A unified view is essential for accurate insights.
5. Set up dashboards and KPIs
Customize dashboards to highlight the metrics that matter most by category, vendor performance, contract renewals, and savings achieved.
6. Train and onboard teams
Ensure procurement, finance, and IT staff know how to interpret dashboards and use analytics in day-to-day decisions.
7. Review and optimize
Analytics isn’t a one-time setup. Continuously monitor performance, refine KPIs, and expand capabilities as the business grows.
Feature Comparison to Look For
When comparing procurement analytics tools, consider:
- Data coverage: Does it consolidate spend from all categories, including SaaS?
- AI capabilities: Does it offer predictive modeling and automated recommendations?
- Visualization: Are dashboards customizable and easy to interpret?
- Integration depth: Does it connect seamlessly with your ERP, finance, and vendor systems?
- Compliance and security: Is the platform certified (e.g., SOC 2, ISO 27001, GDPR-ready)?
Discussion of Implementation Complexity
The complexity of implementation depends on team size, data maturity, and the systems already in place. Smaller companies may adopt basic dashboards quickly, while larger enterprises often face challenges with data integration, governance, and stakeholder alignment. The most successful rollouts treat procurement analytics as both a technology project and a change management initiative, ensuring leadership buy-in and cross-functional support.
Procurement Analytics Use Cases by Function
1. Strategic sourcing analytics
a. What to track
Event pipeline (RFI/RFP/RFQ), competitive intensity (vendors per event), cycle times, savings achieved vs. target, should-cost vs. quoted, and win/loss reasons.
b. Dashboards
Sourcing funnel with bottlenecks, supplier bid scatterplots (price vs. score), and negotiation outcomes by lever (term, ramp, renewal cap).
c. Alerts & actions
Events overdue, single-threaded negotiations (only 1 vendor), bids outside benchmark bands, and ZBB (zero-based budgeting) flags for categories with stagnant refresh cycles.
Example questions:
Which events deliver the highest ROI? Where do we need more competition? Which levers produced the best discounts?
2. Contract management analytics
a. What to track
Contract inventory, renewal dates, auto-renew risk windows, obligation compliance (SLA, DPA, audit rights), CPI/renewal caps, and true-up exposure.
b. Dashboards
Renewal runway (90/60/30 days), clause heatmap (which contracts lack key protections), and value realization vs. SLA credits.
c. Alerts & actions
Auto-renew in <45 days without notice, missing DPAs for apps with PII, usage exceeding commit, and contracts lacking renewal caps.
Example questions:
Which contracts are at risk of auto-renewing unfavorably? Where can we right-size commits before renewal?
3. Supplier performance analytics
a. What to track
SLA attainment (uptime, response/restore), CSAT, defect/incident rates, ticket backlog/ageing, implementation timeline adherence, and adoption/utilization for SaaS.
b. Dashboards
Vendor scorecards (performance × risk × commercial health), QBR packs (trend lines), and benchmark comparisons across peer suppliers.
c. Alerts & actions
Repeated SLA misses, chronic escalation patterns, negative adoption trends post-onboarding, and early warning when roadmap slippage affects must-have use cases.
Example questions:
Which suppliers are underperforming vs. peers? What’s the correlation between incidents and renewal risk?
4. Risk management analytics
a. What to track
Security & privacy posture (SOC/ISO status, pen-test age), financial health, geo/third-party/sub-processor risk, concentration risk, and contract non-compliance.
b. Dashboards
Risk register (RAID), third-party tiering (critical/high/medium/low), and mitigation plans with owners and due dates.
c. Alerts & actions
Expired certs, breach/adverse news triggers, SLA breach streaks, and dependency hotspots (single points of failure).
Example questions:
Which critical vendors lack fresh security evidence? Where do we have single-vendor concentration in high-risk categories?
5. Sustainability / ESG analytics
a. What to track
Supplier ESG ratings, policy attestations, emissions factors (where provided), diversity spend, modern slavery statements, and audit status.
b. Dashboards
Spend with diverse suppliers, ESG score distribution across the supply base, and improvement plans by vendor.
c. Alerts & actions
Lapsed attestations, missing disclosures for high-spend vendors, and sourcing events without ESG weighting.
Example questions:
How much of our spend meets ESG thresholds? Which suppliers need remediation to stay on our preferred list?
Future Trends in Procurement Analytics
Procurement analytics is evolving quickly. What started as basic spend reporting is now moving into predictive and automated decision-making. Here are some of the trends shaping the future:
1. Machine Learning Applications
Machine learning will continue to refine procurement analytics by detecting patterns humans might miss. From identifying anomalies in vendor invoices to optimizing category spend, ML will make procurement smarter and faster.
2. AI-Powered Forecasting
Procurement teams will rely more on AI to forecast renewals, supplier risks, and budget needs. Instead of reacting to changes, leaders will have the foresight to plan and negotiate proactively.
3. Automation Trends
Manual tasks like data cleansing, contract tracking, and renewal reminders will be fully automated. This frees up procurement professionals to focus on strategy, negotiations, and building supplier partnerships.
4. Market Trend Anticipation
Advanced analytics will pull in external data such as market pricing shifts, supplier stability, and global risk indicators to help organizations anticipate changes before they happen. This makes procurement not just a support function but a driver of resilience and growth.
Get Expert Guidance on Tracking Procurement Analytics with Spendflo
Procurement teams that rely on spreadsheets or disconnected systems risk missed renewals, overspending on SaaS, and vendor relationships that are hard to manage. The result? Budgets spiral, and finance leaders lose the visibility they need to plan ahead.
Crownpeak, a Digital Experience Platform, faced the same challenge. By adopting Spendflo’s intuitive savings dashboard, they gained timely renewal reminders and visibility into high-value SaaS contracts ultimately saving 30% on annual SaaS expenses.
But renewal management isn’t the only pain point. Without the right analytics, procurement leaders struggle to identify cost drivers across departments, track contract coverage, and hold vendors accountable.
That’s where Spendflo makes the difference. As an AI-native procurement platform, Spendflo consolidates data, monitors the metrics that matter, and equips teams to negotiate with confidence. From spend visibility to compliance tracking, it ensures procurement becomes a driver of savings, not just a cost center.
Ready to take control of your SaaS spend? Book your free demo with Spendflo and see how procurement analytics can deliver measurable savings and efficiency.
Frequently Asked Questions
1. What’s the difference between procurement analytics and spend analytics?
Spend analytics is a subset of procurement analytics.Spend analytics focuses mainly on analyzing historical expenditures to uncover cost-saving opportunities and trends, while procurement analytics goes further covering supplier performance, contract management, risk tracking, and predictive insights.
2. Can small companies benefit from procurement analytics?
Yes. Also small businesses struggle with such issues as vendor sprawl, shadow IT, or lack of visibility of contracts. Procurement analytics enables them to have control, make better deals and not waste money without having a huge procurement department.
3. What if our procurement data is messy or incomplete?
That’s a common challenge. The initial one is data cleansing, standardization of supplier names, duplicates, and alignment of categories. A lot of contemporary services, such as artificial intelligence solutions such as Spendflo, streamline much of this, so you do not have to load your staff.
4. What’s more important: advanced analytics features or ease of use?
The two are important, but they will be adopted depending on ease of use. The features of advanced features are only good when they are used by the teams. Such a platform as Spendflo comes to the rescue of balance and provides AI-based analytics, presented as a convenient dashboard, supported by procurement specialists.


.png)
.png)