


"If you can’t measure it, you can’t improve it."
That saying still holds true for today’s procurement teams. As businesses grow, their software stack and vendor relationships expand just as quickly, making it harder to see where money is going and what’s actually delivering value.
A recent GlobeNewsWire report projects that the Procurement-as-a-Service market will grow at a steady 6.4% CAGR through 2027. This growth reflects a clear trend: data-driven procurement is no longer optional. Yet, many teams still struggle to identify which metrics matter most. Tracking the right procurement KPIs can make the difference between simply processing purchases and building a truly efficient, strategic function.
What Are Procurement KPIs and Why Are They Essential?
Procurement KPIs are metrics that assess how efficiently and effectively a company manages purchasing activities. They track areas like cost savings, supplier performance, and contract compliance. Monitoring these KPIs helps businesses control spending, strengthen vendor relationships, and improve overall efficiency.
How to Choose the Right Procurement KPIs for Your Business?
The procurement process includes all your procurement department's activities to acquire goods and services. Procurement KPIs are metrics used to assess the effectiveness of your procurement management. These KPIs evaluate how your company manages time, cost, and quality.
When determining these procurement KPIs, you should consider several factors:
- Your business model
- The size of your organization
- The location of your organization
- Compliance requirements
- Your budget
Your selection of procurement KPIs may differ based on your position regarding these five factors. Keep in mind that there is no ideal set of procurement metrics. This is not a universal solution; it requires a customized approach.
Challenges in Tracking Procurement KPIs
81% of leaders believe procurement needs a major transformation. But before reaping the benefits, procurement teams must overcome five key challenges, each with a practical solution.
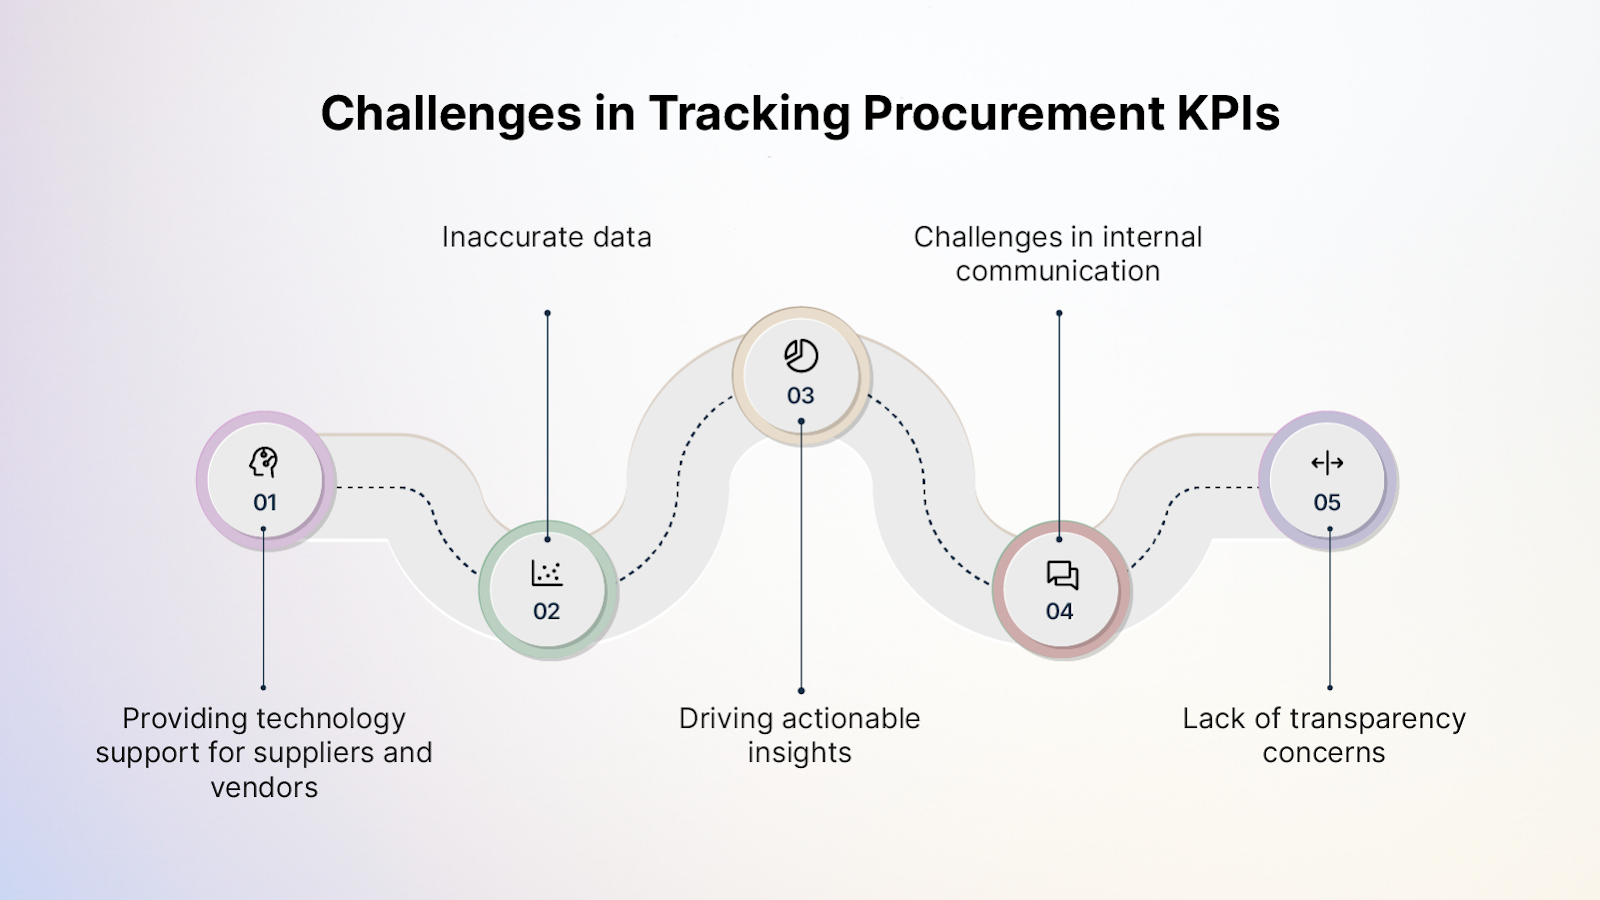
1. Limited Technology Support for Suppliers and Vendors
Challenge: Many suppliers still rely on outdated tools, making collaboration with procurement teams difficult. They may hesitate to share data or learn new systems, slowing progress.
Solution: Offer tailored onboarding and training programs for vendors and suppliers. Choose digital platforms that make participation simple and intuitive. The easier the system, the faster adoption will follow.
2. Inaccurate or Incomplete Data
Challenge: Nearly half of all procurement processes still happen in spreadsheets, according to Supply Chain Dive. Manual data entry drains time, creates errors, and limits visibility into key metrics.
Solution: Adopt automated SaaS procurement tools to centralize data collection and reduce manual work. Platforms like Spendflo bring every purchase, approval, and renewal into one view boosting accuracy, collaboration, and speed.
3. Turning Data Into Action
Challenge: Procurement teams often collect data but struggle to translate it into decisions that drive savings or efficiency. Without context, data remains just numbers.
Solution: Use AI, blockchain, and IoT to extract meaning from data. These technologies enable real-time insights and reliable analysis. Before investing, clarify the purpose, expected outcomes, and ongoing maintenance needs to ensure your tools deliver measurable results.
4. Poor Internal Communication
Challenge: Procurement functions have evolved from transactional to strategic, yet many teams still work in silos. Without alignment across finance, IT, and operations, decisions can miss the bigger financial picture.
Solution: Encourage regular collaboration between procurement and finance teams. Use shared dashboards or communication tools to align on budgets, forecasts, and priorities. Clear communication ensures smarter, faster decision-making.
5. Lack of Transparency
Challenge: According to Supply Chain Dive, 60% of leaders cite poor visibility between finance, procurement, and suppliers as a major risk. This gap limits cost control and can impact cash flow.
Solution: Improve transparency by eliminating manual data entry, integrating procurement analytics into finance software, and standardizing best practices for data sharing. Training employees and suppliers on these practices helps maintain consistency and accountability.
Benefits of Tracking Procurement KPIs
Tracking procurement KPIs is essential for businesses looking to optimize costs, enhance vendor relationships, and improve overall efficiency. By closely monitoring key performance indicators, organizations can identify inefficiencies, mitigate risks, and drive smarter purchasing decisions.
Here are the key benefits of tracking procurement KPIs:
1. Cost Savings
Tracking procurement KPIs helps businesses identify overspending, reduce inefficiencies, and optimize supplier contracts. By analyzing trends and comparing supplier costs, companies can negotiate better deals and cut unnecessary expenses.
2. Improved Supplier Performance
Supplier-related KPIs ensure vendors meet expectations for quality, timely deliveries, and compliance. Businesses can use this data to evaluate supplier reliability, renegotiate terms, or switch to better-performing vendors.
3.Faster Procurement Cycles
Monitoring procurement KPIs allows organizations to pinpoint delays in the purchasing process. Identifying bottlenecks in purchase approvals, supplier negotiations, or invoice processing, helps streamline workflows and accelerate procurement cycles.
4. Better Compliance & Risk Management
Procurement KPIs help ensure that all purchases comply with internal policies and external regulations. By tracking compliance-related metrics, businesses can mitigate financial risks, avoid penalties, and maintain regulatory standards.
5. Stronger Decision-Making
With data-backed insights procurement teams can makeinformed strategic decisions. Analyzing trends in spending, supplier performance, and procurement efficiency leads to smarter purchasing choices and long-term business growth.
How to Measure and Track Procurement KPIs?
Measuring procurement KPIs requires more than collecting numbers, it’s about using data to understand how your procurement process performs, where it lags, and how it can improve. The process typically includes data collection, analysis, and visualization using technology and dashboards.
1. Data Collection Methods
Accurate procurement data is the foundation of meaningful KPIs. Start by identifying what information matters most: supplier performance, purchase order timelines, contract renewals, or savings achieved.
You can collect this data from multiple sources, including:
- Procurement systems: Track purchase orders, approvals, and supplier records.
- ERP tools: Capture spending data and financial transactions.
- Supplier portals: Monitor order accuracy, delivery times, and compliance.
- Manual inputs: Record data that digital tools may not yet capture, but minimize reliance on spreadsheets to avoid errors.
2. Using Technology and Tools
Technology simplifies procurement KPI tracking by automating data collection and analysis. Modern SaaS procurement platforms, like Spendflo, consolidate vendor data, spending patterns, and contract details into one dashboard.
These tools support:
- Automated tracking: Pulls real-time data from integrated systems.
- Error reduction: Eliminates manual data entry and spreadsheet dependence.
- Cross-team collaboration: Links finance, procurement, and IT data for full visibility.
3. Creating a KPI Dashboard
A KPI dashboard translates data into actionable insights. It provides a single source of truth for procurement performance and progress over time.
When building your dashboard:
- Define clear objectives. Identify which KPIs reflect success for your team, such as cost savings, cycle time, or supplier reliability.
- Use real-time visualization. Choose charts and graphs that update automatically from your data sources.
- Segment your metrics. Separate strategic KPIs (spend under management) from operational ones (PO processing time).
- Ensure accessibility. Dashboards should be simple enough for anyone from CFOs to procurement managers to interpret at a glance.
Essential Procurement KPIs Every Team Should Track
Every organization measures procurement success differently, but certain metrics create the foundation for better control and efficiency.
These procurement KPI categories help teams understand spending, evaluate vendor performance, and improve purchasing outcomes.
1. Cost Savings & Financial KPIs
These procurement cost KPIs focus on how effectively your organization manages spending and achieves savings.
1.1 Cost Reduction Ratio
Tracks how efficiently procurement teams reduce costs through sourcing, negotiation, or automation.
Formula: (Baseline Cost – Actual Cost) ÷ Baseline Cost × 100
1.2 Procurement ROI
Measures the financial return for every dollar invested in procurement.
Formula: (Financial Gains from Procurement – Procurement Cost) ÷ Procurement Cost × 100
1.3 Spend Under Management (SUM)
Shows the percentage of company spending managed through approved procurement processes.
Formula: (Managed Spend ÷ Total Spend) × 100
1.4 Maverick Spend Percentage
Highlights unapproved or off-contract purchases that fall outside procurement policies.
Formula: (Unapproved Spend ÷ Total Spend) × 100
1.5 Total Cost of Ownership (TCO)
Assesses the complete cost of an item, including purchase, maintenance, and disposal. It helps teams make informed, long-term decisions rather than focusing only on price.
2. Supplier Performance KPIs
Supplier performance KPIs evaluate how reliable, timely, and consistent your vendors are.
2.1 Supplier Lead Time
Measures the time between order placement and delivery. Shorter lead times improve planning, agility, and inventory control.
Formula: Average (Delivery Date – Order Date)
2.2 On-Time Delivery Rate
Shows how often suppliers deliver on schedule. A high percentage indicates reliability and strong vendor relationships.
Formula: (Orders Delivered On Time ÷ Total Orders) × 100
2.3 Supplier Defect Rate
Calculates the percentage of defective or non-compliant orders. Lower rates reflect better supplier quality and process consistency.
Formula: (Defective Deliveries ÷ Total Deliveries) × 100
2.4 Supplier Sentiment Score
Tracks supplier satisfaction and engagement with your processes. Use periodic surveys or AI-driven tools like Spendflo’s Sentiment Hub to measure collaboration health.
3. Operational Efficiency KPIs
Procurement operational KPIs show how fast and effectively your team processes orders and manages workflows.
3.1 Procure-to-Pay (P2P) Cycle Time
Measures how long it takes to complete a full purchase cycle, from requisition to payment.
Formula: Average (Payment Date – Requisition Date)
3.2 Purchase Order (PO) Cost
Reflects the administrative cost of creating and processing each PO. Reducing PO cost through automation can improve efficiency significantly.
Formula: Total Procurement Cost ÷ Number of POs
3.3 Automation Rate
Shows the share of procurement activities handled automatically. A higher rate means fewer manual errors and faster workflows.
Formula: (Automated Transactions ÷ Total Transactions) × 100
3.4 Contract Utilization Rate
Indicates how often buyers use approved vendor contracts. Higher utilization improves compliance, consistency, and cost control.
4. Quality & Compliance KPIs
Quality KPIs ensure that suppliers and teams adhere to established standards and policies.
4.1 Contract Compliance Rate
Tracks how closely suppliers follow agreed terms, prices, and service levels.
Formula: (Compliant Contracts ÷ Total Contracts) × 100
4.2 Procurement Quality Index
Evaluates overall quality by combining defect rates, delivery accuracy, and satisfaction scores. It provides a high-level view of procurement reliability.
4.3 Risk Mitigation Score
Assesses how well procurement identifies and manages supplier, compliance, or regulatory risks. Helps teams strengthen supply chain resilience.
4.4 Audit Success Rate
Measures the percentage of procurement audits passed without issues.
Formula: (Successful Audits ÷ Total Audits Conducted) × 100
Best Practices for Tracking Procurement KPIs
Tracking procurement KPIs effectively requires a structured approach that ensures accuracy, visibility, and alignment with business goals. By implementing the right best practices, procurement teams can optimize performance, enhance supplier relationships, and drive continuous improvement.
Here are the best practices for tracking procurement KPIs:

1. Define Clear KPI Objectives
Ensure each procurement KPI is aligned with business goals, financial targets, and operational efficiencies. Clearly define what success looks like for each KPI to measure meaningful progress.
2. Use Centralized Procurement Software
Implement a procurement analytics platform to track, analyze, and report KPIs in real time.
This ensures data accuracy, reduces manual errors, and provides visibility into procurement performance.
3. Automate Data Collection & Reporting
Use automation tools to collect procurement data, generate reports, and track trends. Automated dashboards help procurement teams identify patterns, detect inefficiencies, and optimize decision-making.
4. Standardize KPI Measurement & Reporting
Ensure consistent data formats, reporting structures, and benchmarking methods across departments. This helps in accurate performance tracking, trend analysis, and cross-team alignment.
5. Conduct Regular KPI Reviews
Review procurement KPIs periodically to adjust strategies based on changing business needs. Use quarterly or monthly performance assessments to identify areas of improvement.
6. Benchmark KPIs Against Industry Standards
Compare procurement KPIs against industry benchmarks and competitors to identify gaps, opportunities, and improvement areas. This helps businesses stay competitive and cost-efficient.
How Spendflo Helps You Track and Optimize Procurement KPIs
Many procurement teams struggle to keep up with growing vendor lists, scattered contracts, and inconsistent data. Without a centralized view, tracking procurement KPIs becomes guesswork, teams spend hours digging through spreadsheets instead of acting on insights.
One global SaaS company faced the same challenge. Their finance team managed 80+ vendor contracts spread across multiple drives, making it impossible to track renewals and cost savings. After adopting Spendflo, they consolidated all contracts into one searchable dashboard and reduced time spent on procurement tracking by 40%. Within three months, they achieved full visibility into spend under management and improved supplier compliance rates by 25%.
Even today, many organizations face the same pain point, a lack of visibility that slows decision-making and erodes savings. Spendflo solves this by acting as your all-in-one procurement command center. It automates KPI tracking, centralizes contracts and purchase orders, and delivers real-time dashboards to measure cost reduction, supplier performance, and spend efficiency.
If your team still relies on manual tracking or disconnected tools, now is the time to simplify. Spendflo brings every procurement insight together, saving time, improving compliance, and helping you hit every KPI target with confidence.
Ready to see it in action? Book a demo with our experts today and learn how Spendflo can help you achieve measurable savings and complete procurement visibility.
FAQs
1. What are the 5 most common procurement KPIs?
The five most common procurement KPIs are Cost Reduction Ratio, Procure-to-Pay Cycle Time, Supplier Lead Time, Contract Compliance Rate, and Spend Under Management (SUM). These metrics help procurement teams track financial efficiency, supplier reliability, operational performance, and compliance, all of which directly influence cost savings and business outcomes.
2. How do you calculate Procurement ROI?
Procurement ROI measures how much value your procurement function generates compared to what it costs to run. It’s calculated using the formula:
(Financial Gains from Procurement – Procurement Cost) ÷ Procurement Cost × 100.
A positive Procurement ROI shows that the team is effectively reducing spend, improving supplier contracts, and creating measurable savings for the business.
3. What is a procurement KPI dashboard?
A procurement KPI dashboard is a visual reporting tool that consolidates key procurement metrics into one view. It allows teams to monitor cost savings, supplier performance, and contract compliance in real time. Dashboards make it easier for finance and procurement leaders to identify trends, address risks, and make faster, data-driven decisions.
4. How does technology help in tracking procurement KPIs?
Technology automates data collection, analysis, and reporting, eliminating manual errors and delays. AI-powered procurement tools like Spendflo centralize spend data, vendor performance metrics, and contract details into a single platform. This enables teams to track KPIs automatically, gain real-time visibility, and act quickly on opportunities to save time and money.


.png)
.png)